Nikola Petkovic

Observability blogging

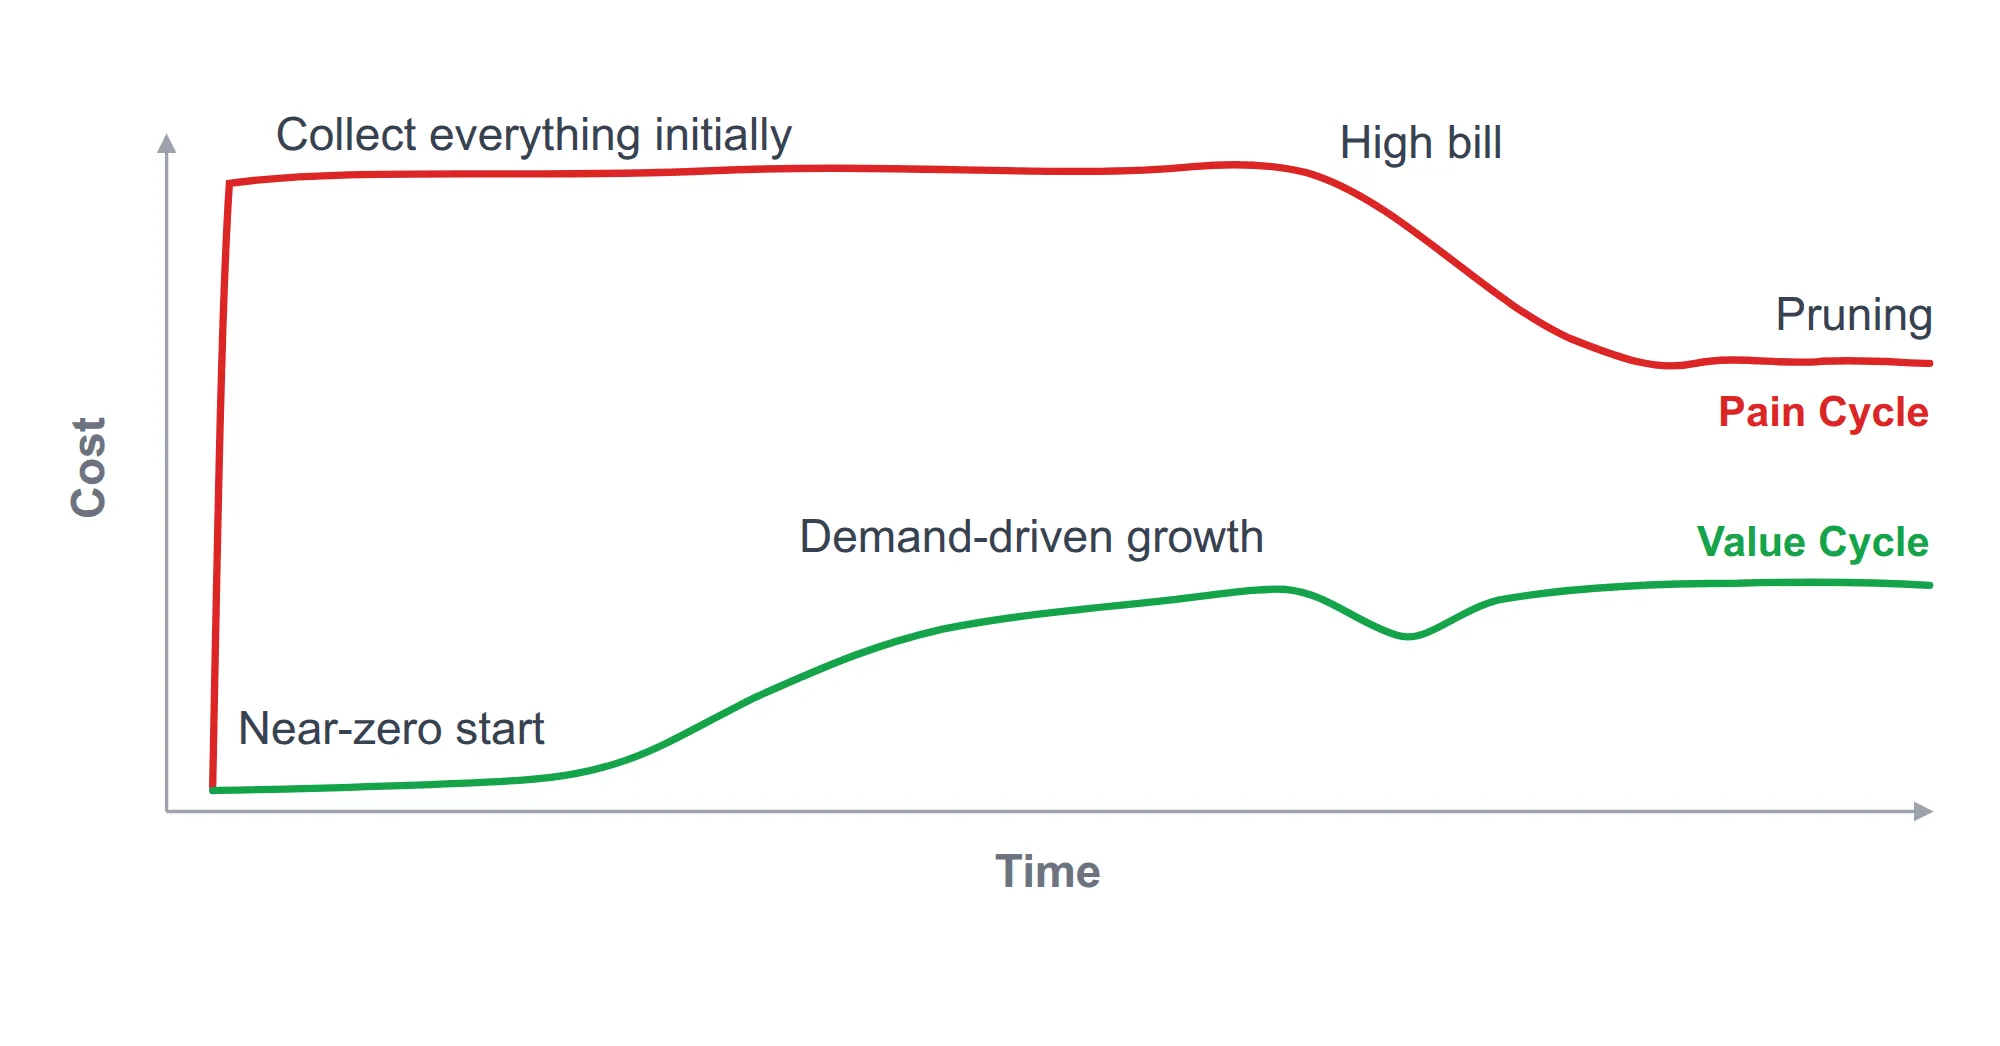
Cost-over-time chart with two curves. The Pain Cycle cost jumps to the top and is pruned onto a still-high plateau, the Value Cycle cost starts near zero and grows with demand
Observability

The Observability Value Cycle

Nikola Petkovic··7 min read
Cost-over-time chart showing collect-everything cost held at the top of the range until the bill lands, then reactive pruning onto a still-high plateau
Observability

The Observability Pain Cycle

Nikola Petkovic··7 min read