You know this story. Infrastructure goes cloud-native, you set up observability with a vendor because you want to focus on building your application, not the plumbing around it, observability costs climb, someone panics at month-end, you do an audit, drop some telemetry signals, costs come down — and three months later you’re doing it again.
That’s not bad luck. It’s not a budget process problem. It’s not about picking the wrong vendor. It’s a structural issue embedded in how observability platforms are designed. The situation is already bad, but with exploding telemetry volumes, which come with AI era, it is becoming much worse.
It wasn’t always this way
In the age of physical servers and monolithic apps, “store everything” was a sensible approach. Telemetry volumes were small and predictable — application logs, a handful of system metrics, maybe some APM traces for critical services. Producing telemetry took real effort back then: you instrumented your code by hand, wired up each metric, and getting the coverage you needed was slow, deliberate work. Vendors built their platforms around one proposition: “Send us all your telemetry and query what you need.” Overpaying slightly for noise was fine because the total was well below the pain threshold.
Then infrastructure changed. Containers, microservices, Kubernetes, cloud-native architectures, auto-instrumentation, distributed tracing across dozens of services. Telemetry volumes went from hundreds of metrics and a few log streams to something orders of magnitude larger. And producing it stopped being work at all — today it’s surprisingly easy to generate and ship tons of telemetry: flip on auto-instrumentation, enable a library’s built-in metrics, scrape the whole cluster, and the data floods in without anyone writing a line of code. The “store everything” model — never revisited — scaled right along with it.
The signal-to-noise problem
Here’s a concrete number: a common Kubernetes deployment exports over 70,000 metrics. A typical team actively queries a few hundred of them. The rest is noise — collected, shipped, indexed, stored, and billed, providing practically zero value.
Noise isn’t neutral. Paradoxically, you pay more to get less value. It degrades query performance. It makes AI-assisted analysis less accurate because the signal is contaminated with irrelevant data. And it obscures what actually matters by drowning it in data that doesn’t.
But noise doesn’t announce itself. There’s no flag in your observability platform marking a metric as “never queried.” It just ships, every minute, continuously.
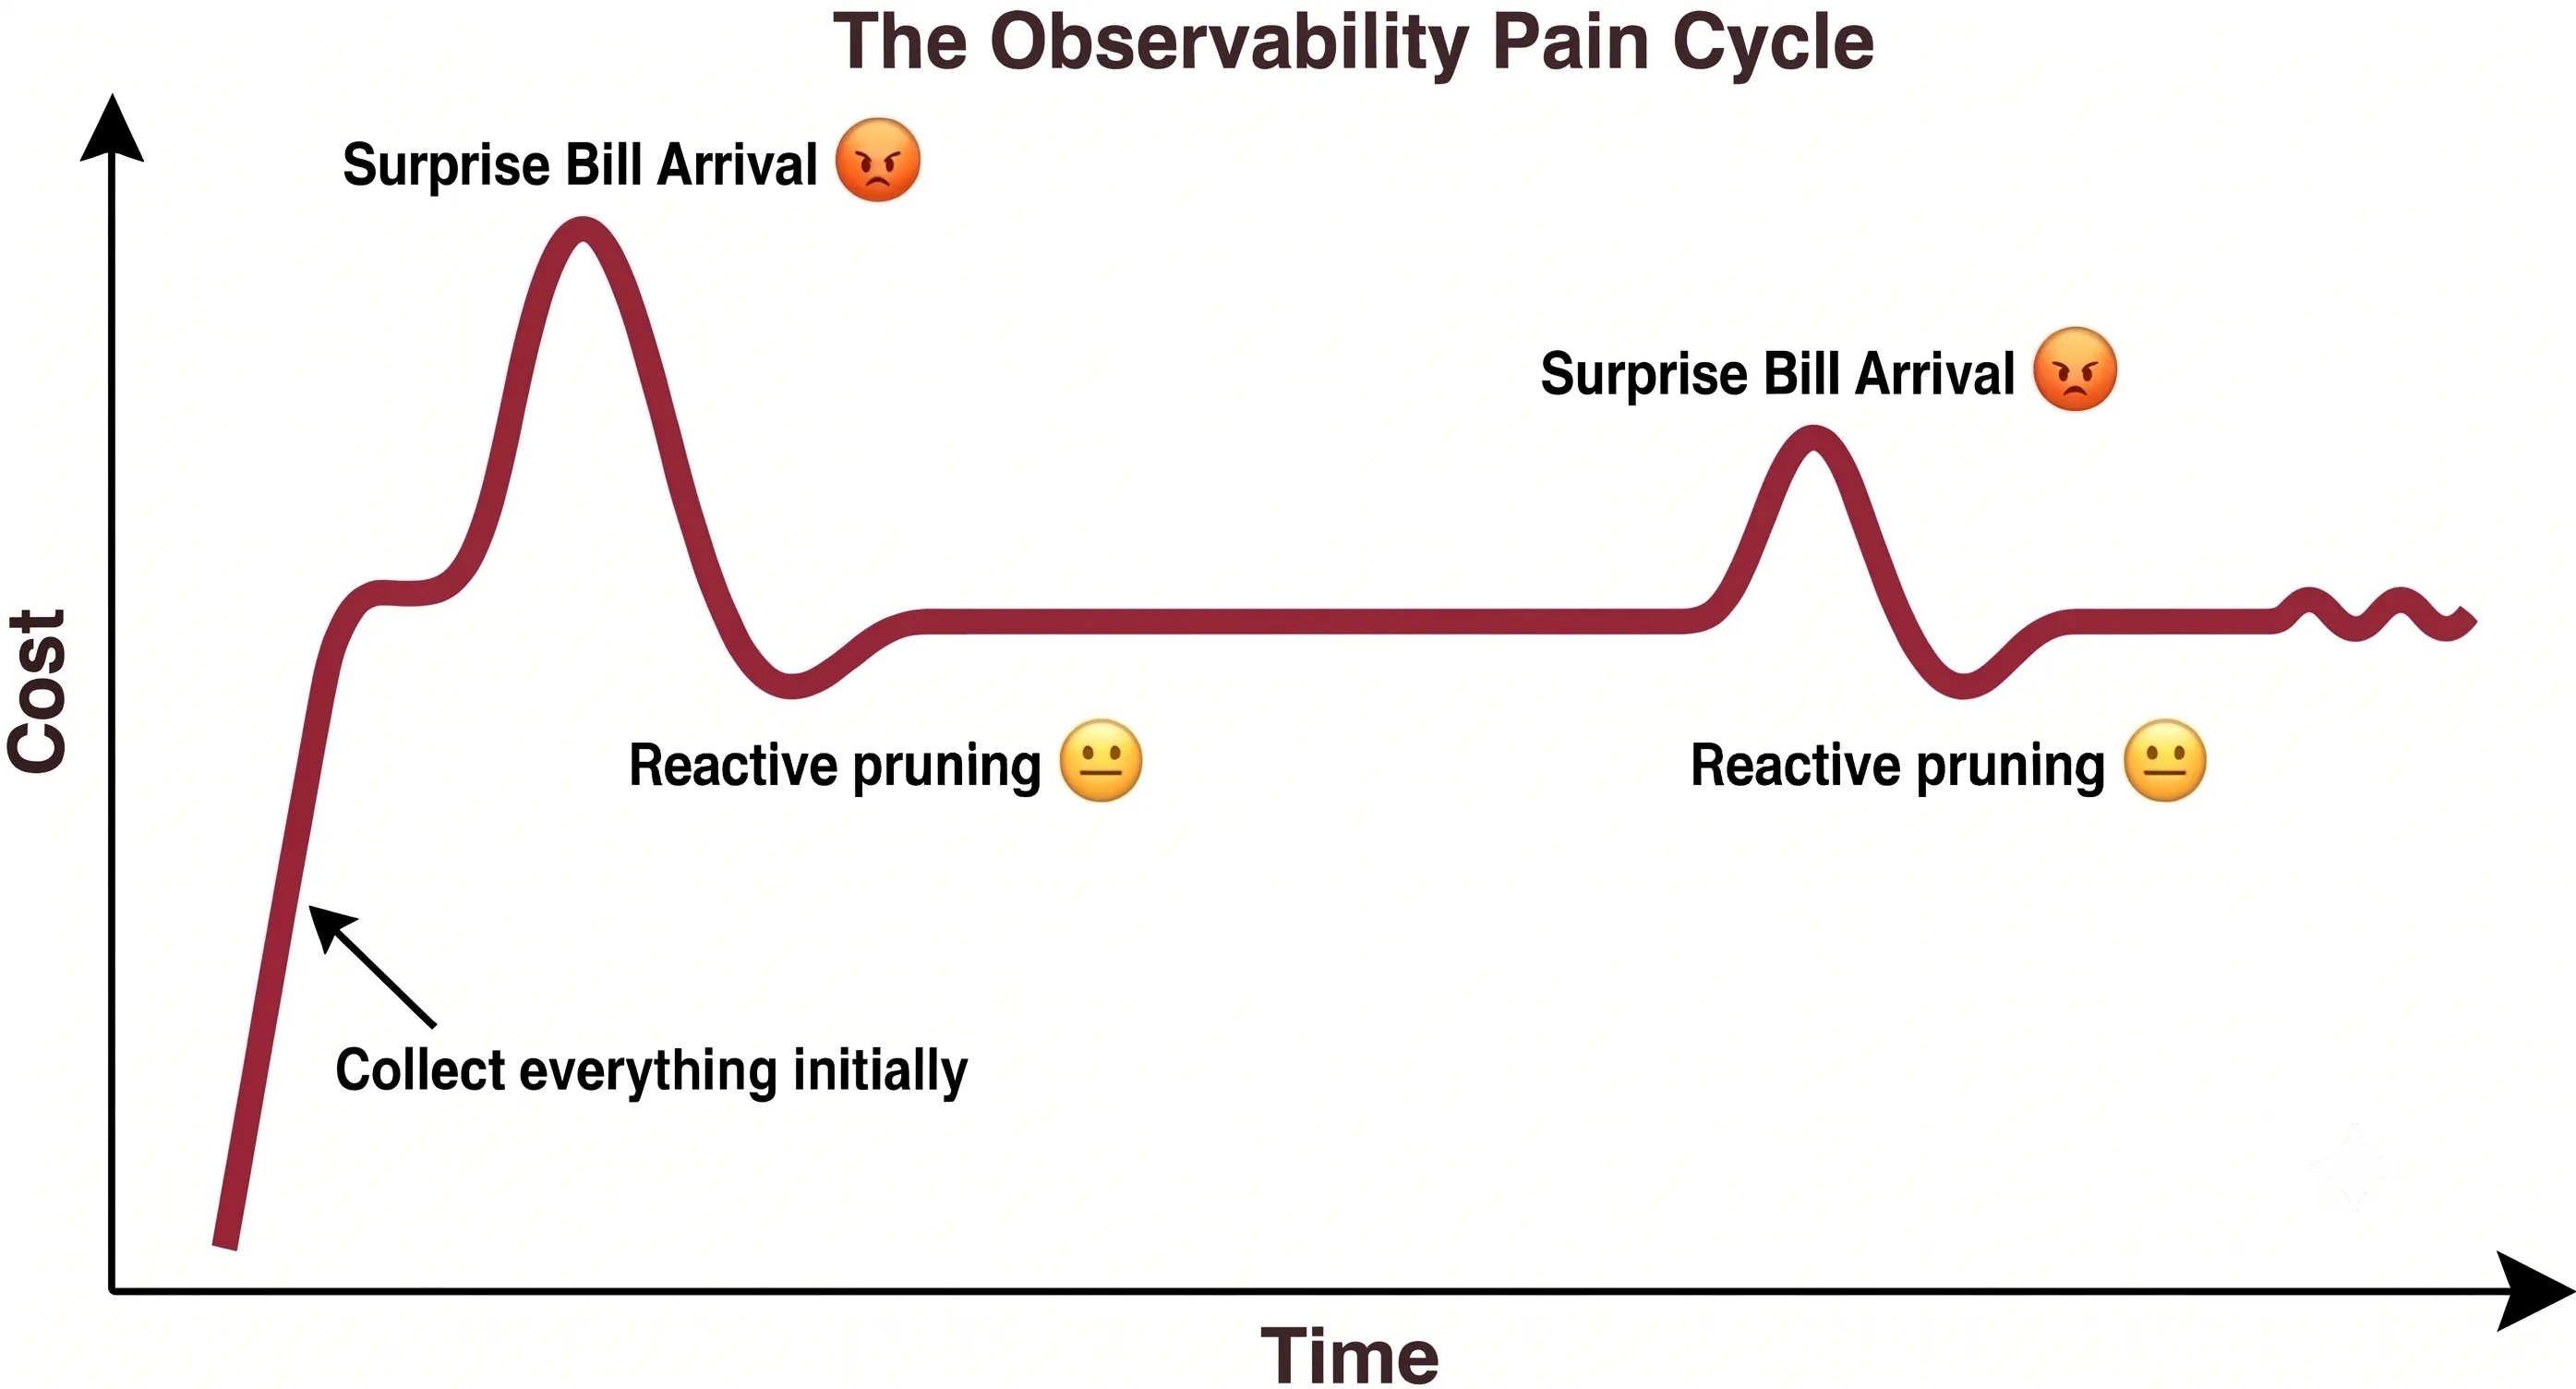
The Pain Cycle
This is how it plays out, in almost every team running modern cloud infrastructure. Notice what drives each turn of the cycle: improvement rarely happens until it hurts. The work of cleaning up telemetry seldom starts on its own — it’s usually set in motion by the pain of a shock bill. For most teams the bill is the signal strong enough to force action, so improvement tends to happen reactively, after the damage is already done. And the goal is rarely the optimum — it’s just to get costs back below the pain threshold. Once the pain subsides, the effort stops, leaving plenty of waste still in place until the next shock. Because the corrective action only ever comes after the pain of a bill shock, and because the same sequence keeps repeating, it earns its name: The Pain Cycle. Here is how it usually unfolds.
- Store everything → bill shock
Following the vendor’s recommendations — and the countless tutorials online that echo them — you turn every instrumentation on, which these days is trivially easy to do. The agent collects everything — logs, metrics, traces, auto-instrumented spans, Kubernetes node metrics, JVM internals. Nobody questions this because that’s what you’re supposed to do. Costs grow suddenly and at the Month-end the bill is larger than expected. Finance asks questions.
- Reactive analysis → restraint
Post-shock, someone runs an audit. They find redundant metrics, duplicate traces, log lines nobody has queried in months, entire namespaces added and forgotten. The waste is real — but you’re measuring it after the damage is done. The analysis takes days, requires deep system knowledge, and pulls engineers away from more meaningful application work.
- Drop signals → reduce flow
Armed with that analysis, the team applies coarse filters. Drop these log levels. Sample these traces at 10%. Exclude these metric prefixes. Costs come down — enough to close the incident, enough to satisfy finance. Everyone moves on.
- Workload changes → back to step 1
A new service launches. A team enables auto-instrumentation on a high-traffic path. Traffic patterns shift. The filters from step 3 were calibrated to a workload that no longer exists. Data volume climbs again. The cost-value balance degrades silently — until the next bill.
The damage goes beyond the up-and-down pattern on the chart. You’re always one step behind your own costs — reacting to a bill that has already arrived instead of managing telemetry flows before they grow out of control. You never fully understand how those costs map to the value you got, so every round of pruning is a guess made under pressure. And because you only ever fix the bill, never manage the underlying flow, the same problem comes back the moment the workload shifts. It’s firefighting where you needed fire prevention — and the fire keeps returning.
Why are we tolerating the pain?
If the cycle is this predictable, why does it persist? Part of the answer is that vendors are skilled at keeping you comfortable inside it. The sales playbook is well-worn and, in the moment, every line of it sounds reasonable.
“You never know if you’ll need it later — you’re safer storing more.” This is the mother of all sales arguments. Fear of the one missing data point at 3 a.m. is a powerful motivator, and it quietly justifies keeping everything forever. Notice what it does: it pushes you to accept a bigger bill out of fear, rather than inviting you to make the call based on your own context — which you, not the vendor, understand best. The value is real sometimes and it is exactly what you should do in some cases, which is what makes the argument appear more effective. But it’s wielded without ever drawing the honest line between what a signal costs and what it’s worth, so it protects the noise right alongside the signal. And the honest truth is that the vast majority of signals could be cut without any fear at all — the chance you’ll ever reach for them is vanishingly small, even in the rare, more extreme incidents. The fear is real for a thin slice of your telemetry; the argument just stretches it to cover everything.
“Storage keeps getting cheaper — just store everything.” Some vendors lean into this, pricing raw storage cheaply to make volume feel like a non-issue. Cheap storage is dangled as the reason not to think about volume, conveniently skipping that more data makes search slower and more complex, and that you’ll still pay your cloud provider for network egress on every byte shipped out.
“Look at these new AI features.” A shiny demo of anomaly detection or natural-language querying is waved in front of you so that the underlying problem — too much noise — slips out of focus. The features are real; they just don’t address why you’re drowning in data in the first place. Worse, the noise drags the AI down too: every irrelevant signal it has to wade through burns more tokens, slows the answer, and raises the chance it latches onto something irrelevant and hallucinates. Feeding a model a cleaner set of signals would make these features cheaper and more accurate — the opposite of what “store everything” gives you.
And for some teams (which are fewer and fewer with every new day), none of this even registers as a problem. Companies with generous budgets don’t mind spending more on observability, not realizing that a large share of what they pay is for noise — noise that doesn’t just cost money but also degrades query speed and contaminates analysis. For others, the bill, even when it’s clearly larger than the value it returns, still sits below the pain threshold. The vendor happily takes the money. But a transaction being painless enough to tolerate doesn’t make it a fair one.
What is under the hood?
The bill is a symptom. The actual problem is structural: there is no link between what you pay and what you get.
At any given moment, your team cannot answer a simple question: which of the signals we’re collecting are actively serving a need, and which are just stored with practically zero chance of ever proving useful?
Vendors will happily break the bill down for you — by data type, by source, by host — and call it “transparent billing”. But none of those line items tell you what you actually want to know: which of these signals is worth paying for? What no vendor offers is a breakdown by value — a view of which signals are actually earning their cost and which are just sitting there being billed.
Without that visibility, precision is out of reach. Coarse filters are the only tool available, which means you’re always choosing between over-pruning (removing signals you’ll need at the next incident) and more likely under-pruning (keeping noise that keeps costing money). There’s no middle path, because you can’t see which signals fall on which side of the line.
Why AI doesn’t fix this
Modern observability platforms have invested heavily in AI: anomaly detection, incident correlation, natural-language querying, PromQL assistance. These are genuinely useful for incident response and day-to-day operations.
But they’re applied tactically — on top of a data model that was never designed with signal value in mind. They help you understand the data you already have. They don’t question whether you should have collected it in the first place. The pipeline architecture is where the structural problem lives, and that architecture hasn’t fundametally changed. Adding AI on top makes the existing model slightly more efficient. It doesn’t change what the model is.
Every major observability vendor runs this cycle
All major observability vendors, even the younger, more innovative ones, operate on the same fundamental model: collect everything first, store it, bill for it. If you don’t complain, the billing keeps going. If you do, they offer help in the form of post-mortem analysis and pruning tools (cardinality reducers, sampling pipelines, usage dashboards) to manage the symptoms. None of it changes the underlying dynamic.
There’s a structural reason for this. By default, vendors help you turn on every available instrumentation library, collect everything you can, and send it to their backend. And these days it’s trivially easy to generate telemetry and ship it — you often don’t even have to instrument your own code. Many libraries already emit metrics, traces, and structured logs. You can flip on auto-instrumentation, or even collect events straight from the Linux kernel.
Telemetry waste is part of their revenue model: the noise you’re paying for is what they earn on. Fixing the root cause would mean cannibalizing existing business. That’s an incentive constraint. Which is why cost-management features from incumbents always feel slightly incomplete. They’ll break down your bill into line items to signal “transparent billing”, but by design you still won’t get the missing link: a detailed, signal-level connection between what you paid and the business value you got.
Conclusion
The Pain Cycle is the default behavior of the current observability architecture. You’re operating within the constraints of a model that was designed for a different era.
Once, noise was barely worth mentioning. Then volumes grew and it became impossible to ignore. Now it hurts, badly, and telemetry is still climbing. It’s only a matter of time before this model breaks down under the burden of ever-increasing telemetry volumes — volumes that, with the AI breakthrough, are now growing at an incredible rate.
← All posts